
Market Status
The market is operating under minimal institutional participation. Price action lacks volume validation, creating a bid-side vacuum in which prices move primarily because buyers have withdrawn, not because aggressive selling has intensified.
Key Argument: The VIX–VVIX Divergence
The relationship between VIX, which measures equity volatility, and VVIX, which measures the volatility of VIX, is currently our central predictive indicator.
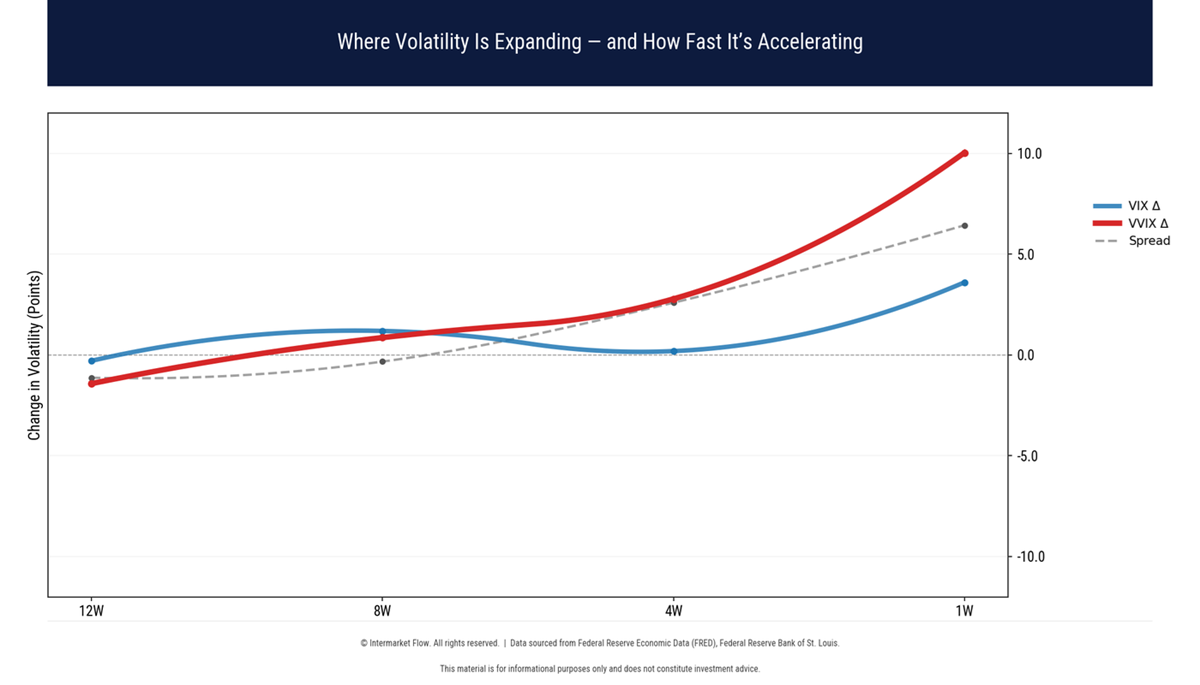
As the graph above shows, VVIX is accelerating significantly faster than VIX.
Structural Divergence
- When VVIX rises while VIX remains anchored, the market is repricing the probability of a future volatility shock rather than reacting to a fully developed equity-volatility event.
- Predictive Weight: This divergence indicates that stress is concentrated within derivative structures and may act as a leading indicator of broader systemic transmission.
Liquidity Stress and Confirmation
To quantify this regime, we use the Liquidity Stress Ratio:
LSR = Σ|Z_VOL| / Σ|Z_VOLAT|
Where
Z_VOL measures abnormal volume conditions.
Z_VOLAT measures abnormal volatility conditions.
Σ represents the aggregate reading across the analyzed assets.
LSR Analysis and Volume current weekly flows
Th following volume chart provides the defining context for the current liquidity vacuum.
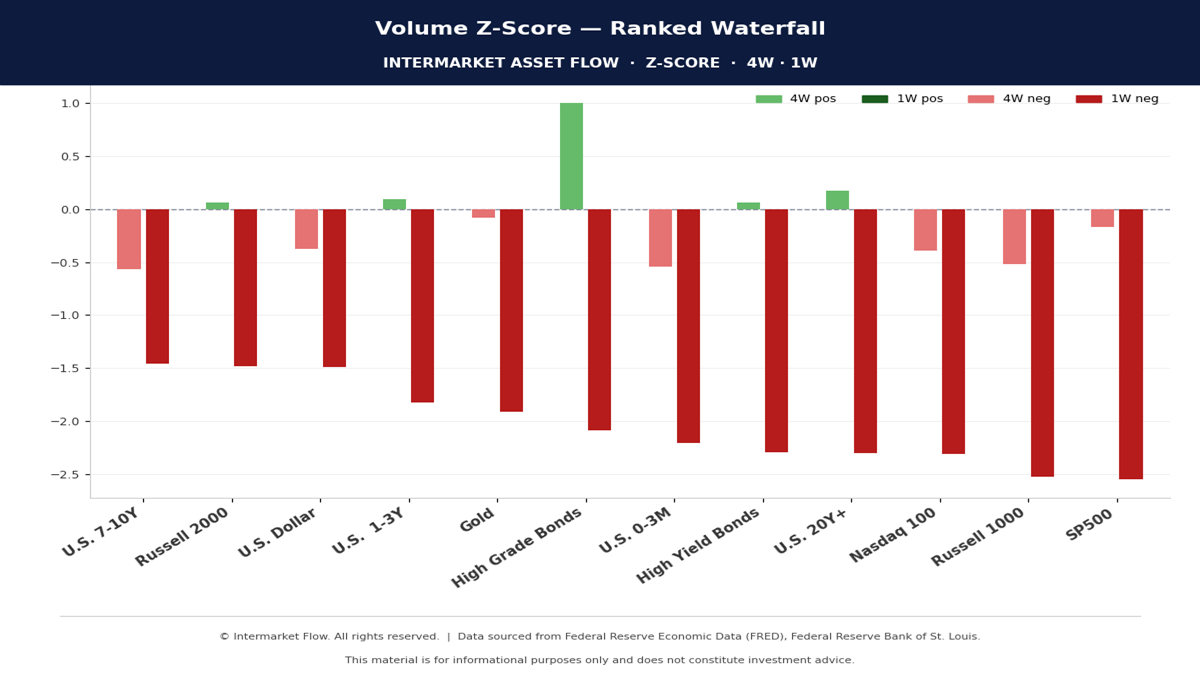
- The systematic clustering of assets with Z_VOL readings between −1.5 and −2.5 shows that current price action is developing without normal market participation.
- Extreme negative volume readings across the asset spectrum confirm a market disconnected from genuine depth. Under these conditions, price movements become unstable and disproportionately amplified because the volume floor has collapsed.
- The direction of the LSR must be interpreted together with its components. A change in the ratio is meaningful only after determining whether it was caused by volume deterioration, volatility expansion, or both.
Asset Mapping: Equities and Treasuries
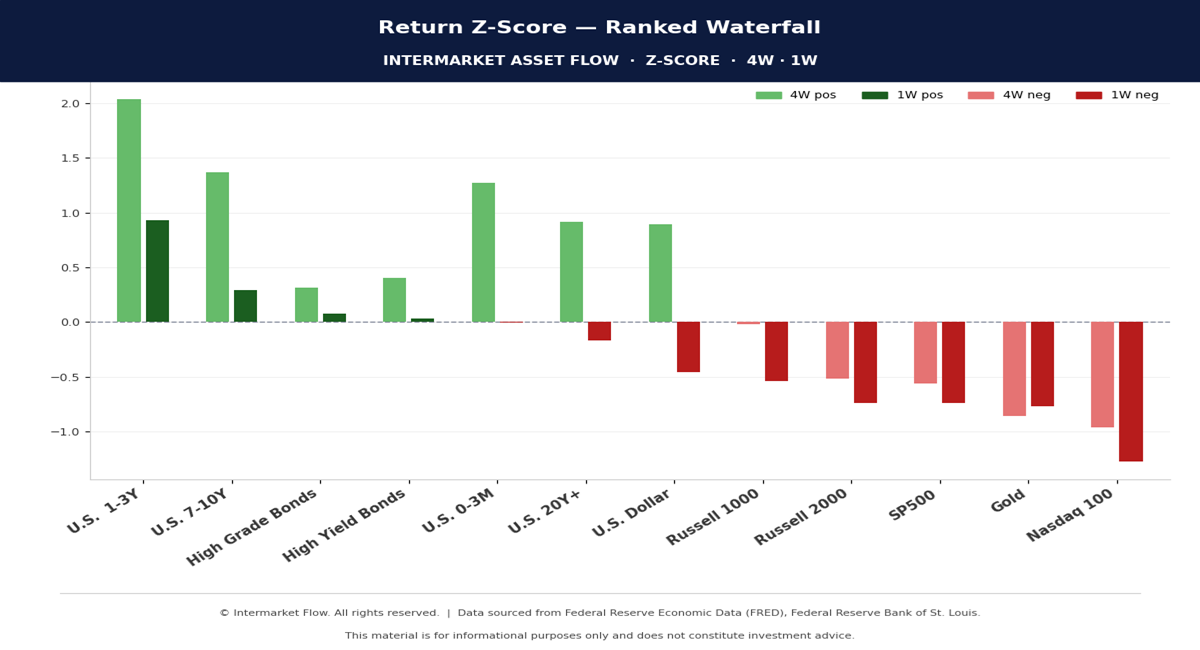
Equities
- As shown in risk assets exhibit significantly weaker one-week returns than four-week returns, signaling an acceleration in the withdrawal of risk.
- Any rebound remains structurally weak because there is no volume confirmation or evidence of institutional accumulation.
U.S. Treasuries
- Treasury prices remain relatively stable, but volume flows are deeply negative, with Z_VOL readings between −1.5 and −2.3.
- This indicates that current Treasury strength is developing inside a liquidity vacuum rather than through a clean flight to quality.
Volatility Fragmentation
Volatility is not expanding uniformly across markets.
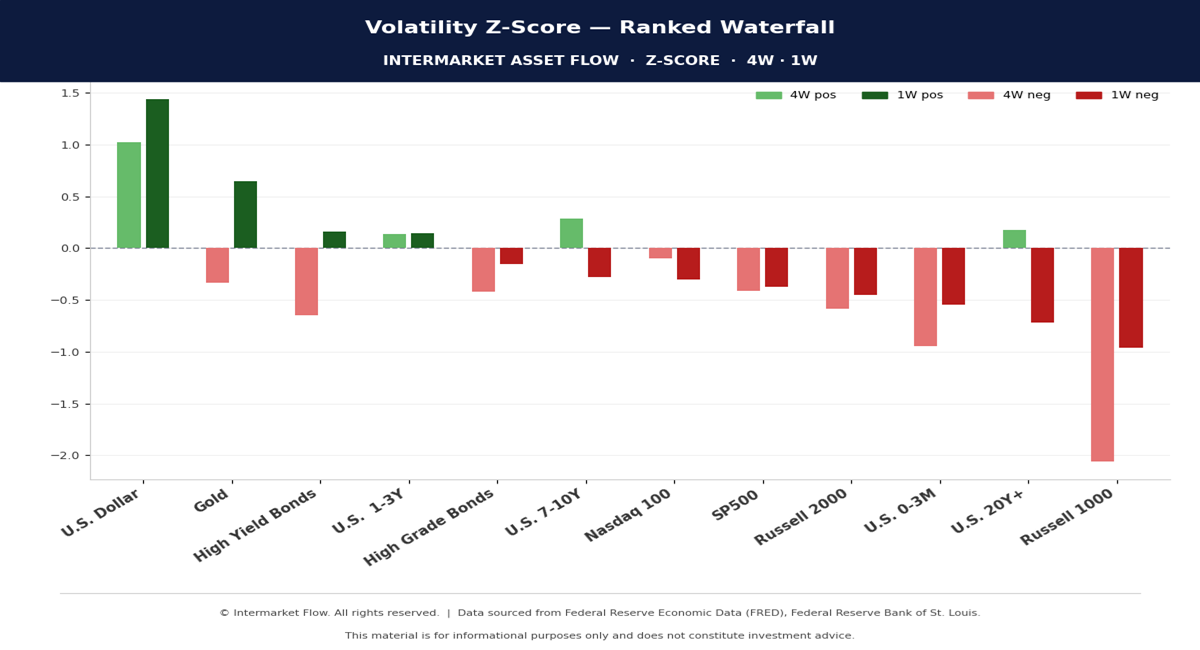
- The U.S. Dollar and Gold register rising volatility readings of approximately +1.45σ and +0.65σ, respectively.
- These movements identify localized pressure points within the broader liquidity vacuum. They do not yet confirm a clear defensive allocation or a genuine flight to quality.
Strategic Framework and Operational Block
- Signal: Z_VOL below −1.5 across risk assets.
- Validation: Continued widening of the VVIX–VIX spread.
- Reading: Artificial liquidity regime with high vulnerability to abrupt gaps and unstable price movements.
- Implication: Any rally under the current volume profile must be treated as a liquidity trap until participation confirms it.
Action Plan: Four Strategic Pillars
1. No “Buy the Dip”
- With VVIX expanding relative to VIX, buying into the decline is not a valid strategy.
- Without volume support, the dip is more likely to provide an exit for remaining liquidity than a genuine value-entry zone.
2. No Additional Risk Deployment
- Adding exposure is not justified.
- The risk-reward profile remains distorted by derivative instability, minimal participation, and the lack of reliable price discovery.
3. Maintain Hedges
- The optimal moment to establish protection was last week, as stated in the previous report.Hedging costs have since increased.
- However, as long as the VVIX–VIX spread does not narrow, expensive protection remains preferable to unprotected exposure.
4. Cash Dominance
- Cash remains the only viable stance until one of the following conditions is met:
- Z_VOL returns toward neutral levels.
- Weekly Z_VOL rises above +1.5σ with clear directional confirmation in Z_RET.
- The LSR stabilizes alongside a measurable return of market participation.
- The VVIX–VIX spread begins to narrow consistently. High relevance leading indicator
Technical Summary
- The market is trapped in a low-volume feedback loop.
- Capital is retreating, not rotating. Price movements are being amplified by the lack of counterparties rather than validated by institutional conviction.
- The VVIX–VIX spread remains the decisive variable for identifying a potential regime change.
Until volume returns, the market must be managed defensively. Any rally without volume confirmation is a liquidity trap, and any execution that ignores these constraints must be classified as an operational error.
Macro Context
This week’s price action unfolded against a backdrop of macro data that was broadly better than expected:
- Including CPI, PPI, Initial Claims, and parts of the Housing Starts report.
- That data triggered a meaningful repricing of the expected rate path.
- Yet, none of it was enough to lift prices; buyers did not appear.
- The long trade does not attract volume, and therefore, there is no accumulation.
- Under these conditions, a correction is likely to arrive sooner than later. This is a highs-and-bottoms hunting environment, not a clean trend-following setup. Risk takers land.
Intermarket Flow
If you believe this is an error, please contact the administrator.